
This article delves into the fundamental concepts of Magnetic Resonance spectroscopy required for IIT JAM, covering principles, instrumentation, and applications, helping students prepare for competitive exams like CSIR NET, IIT JAM, CUET PG, and GATE.
Fundamental concepts of Magnetic Resonance spectroscopy For IIT JAM
Let’s be honest—preparing for the IIT JAM can feel like trying to drink water from a fire hose. When you open Unit 5 of the physical chemistry syllabus, Magnetic Resonance spectroscopy is usually sitting there looking incredibly intimidating.
If you’ve flipped through Atkins’ Physical Chemistry or tried cracking structural problems in Silverstein, you already know that Nuclear Magnetic Resonance (NMR) is a massive score-booster if you get it right. It is easily one of the most powerful analytical tools we have for figuring out organic structures. Instead of memorizing endless reactions in Magnetic Resonance spectroscopy, NMR lets you map out the molecular structure, dynamics, and the actual chemical environment of different nuclei.
To ace the JAM, you don’t need to become a quantum physicist overnight. You just need to focus on three big things: the physical and chemical basis of the signals, the main types of NMR, and how to apply them to solve organic structures.
Fundamental concepts of Magnetic Resonance spectroscopy For IIT JAM: Principles and Instrumentation
At its core, Magnetic Resonance spectroscopy is like giving molecules a medical check-up using radio waves. It all starts with a fundamental property called nuclear spin.
Think of certain nuclei like tiny, spinning tops. Because they have a charge and they’re spinning, they generate a tiny magnetic moment. Now, imagine walking into a room full of compass needles pointing in every random direction. If you turn on a massive, powerful magnet, all those needles are suddenly going to snap into alignment.
That’s exactly what happens in an NMR machine. When you place your sample in a strong magnetic field (B0), the nuclear spins align themselves. They can either line up with the field (the low-energy, chill state) or against the field (the high-energy, stressed state). The gap between these two energy states depends entirely on two things:
-
The strength of the big magnet you are using.
-
The local chemical environment surrounding that specific nucleus.
By hitting the sample with radiofrequency radiation, we can give those low-energy spins just enough juice to flip into the high-energy state. When they flip, we get a signal. Because different atoms in a molecule are surrounded by different electron clouds, they experience the main magnetic field differently. This gives us unique signals for different parts of the molecule, making it an incredible tool for mapping out a structure.
Fundamental concepts of Magnetic Resonance spectroscopy For IIT JAM: Instrumentation and Techniques
So, what does the hardware actually look like? An NMR spectrometer is basically made of three main parts: a super-strong magnet, a radiofrequency (RF) coil, and a sensitive detector.
To get clean, sharp data, you need an incredibly steady and powerful magnetic field. That’s why modern labs use superconducting magnets. These are cooled down with liquid helium to near absolute zero so electricity flows with zero resistance, keeping the magnetic field perfectly stable.
Depending on what you are trying to find out about your sample, you can tune the machine to look at different nuclei. The most common techniques you will see on the IIT JAM are 1H NMR (looking at hydrogens), 13C NMR (looking at the carbon backbone), and sometimes 31P NMR (great for phosphorus compounds).
Instrumentation: Understanding the Components of an NMR Spectrometer
To visualize how these pieces work together, let’s look at the basic workflow inside the machine.
The big magnet aligns the spins. The RF coil sends out a quick pulse of radio waves to disturb that alignment, acting like a gentle push to our spinning tops. As the nuclear spins relax and return to their normal state, they emit a weak radio signal. The detector picks up these tiny signals and sends them straight to a computer. The computer processes the raw data and spits out a clean spectrum, plotting signal intensity against frequency.
Here is a look at what raw data points look like before they are turned into the neat peaks you see in exam questions:
| Frequency (Hz) | Signal Intensity |
| 2160 | 1.2 |
| 2170 | 2.1 |
Understanding how the magnet, coil, and detector work together makes it much easier to understand why certain experimental factors change the look of your final spectrum.
Misconception: Common Misconceptions about Magnetic Resonance Spectroscopy
A really common trap that many JAM aspirants fall into is thinking that Magnetic Resonance spectroscopy is just another tool to measure molecular weight.
That is actually a completely different technique (Mass Spectrometry). NMR doesn’t care about how heavy a molecule is; it cares about how the atoms are connected and what their neighborhoods look like. It tells you about chemical shifts (where the peaks land), coupling constants (how peaks split because of neighboring atoms), and relaxation properties.
At VedPrep, we always remind our students that NMR isn’t just a static picture for identifying an unknown bottle in the lab. It helps us look at molecular dynamics, see how molecules bend and twist in real-time, and figure out exactly how reactions happen step-by-step.
Application: Real-World Applications of Magnetic Resonance Spectroscopy
To see why the examiners love this topic so much, it helps to look at how it’s used outside the classroom.
As per Magnetic Resonance spectroscopy, imagine a fictional pharmaceutical company trying to develop a new medicine to treat a major disease. The researchers might synthesize a promising compound, but before they can ever test it, they need to know if they actually made the right molecule. They use NMR to verify the exact structure, check for tiny impurities, and even watch how the drug molecule binds to a target protein.
NMR is also a big deal in the food industry. For example, imagine a quality control lab testing high-end olive oil. By running a quick spectrum, they can look at the fatty acid profiles to instantly spot if a batch has been watered down with cheaper seed oils.
In biology, it lets scientists study how massive proteins fold up or misfold in diseases like Alzheimer’s. It’s a versatile technique that stretches far beyond simple chemistry labs.
Exam Strategy: Tips for Success in IIT JAM Magnetic Resonance Spectroscopy
If you want to score high in Magnetic Resonance spectroscopy in the IIT JAM, you need a solid game plan. Don’t start by trying to memorize complex spectral charts. Start with the core physical principles—understand what magnetic resonance actually means, how shielding works, and what the instrumentation does.
Once the basics feel natural, start solving problems. NMR is a skill, much like driving a car; you can’t learn it just by reading a manual. You need to look at raw spectra, practice predicting splitting patterns, and work through past-year questions. Keep an eye out for frequently tested subtopics like:
-
Proton (1H) and Carbon-13 (13C) NMR
-
Coupling constants (J-values) and peak splitting
-
Advanced ideas like 2D NMR and the Nuclear Overhauser Effect (NOE)
If you ever feel stuck or overwhelmed by the sheer volume of spectral splitting rules, the team at VedPrep has put together structured study materials and practice question banks designed specifically to make these patterns click without the stress.
Worked Example: Solution to a IIT JAM-Style Problem
Let’s look at a classic problem type that tests your grasp of the core math behind the physics.
Problem:
A spin-1/2 nucleus is placed in a magnetic field of 4.7 Tesla. If the gyromagnetic ratio (γ) of the nucleus is 2.68 × 10⁸ rad T-1 s-1, calculate the frequency of the radiation required to flip the spin.
Solution:
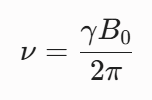
The Larmor equation gives us the direct relationship between our radiation frequency, the magnetic field strength, and the specific nucleus we are looking at:
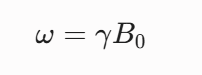
Where ω is the angular frequency, γ is the gyromagnetic ratio, and B0 is the magnetic field strength.
Since angular frequency is related to regular frequency (ν) by ω = 2πν, we can rearrange the equation to solve for ν:
Now we just plug in our given numbers:
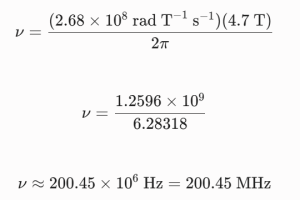
Key Takeaway: The Larmor equation shows that the flipping frequency scales perfectly with the strength of the magnet. If you double the magnetic field, you double the energy gap, meaning you need a higher frequency to get a signal.
Conclusion
At the end of the day, Magnetic Resonance spectroscopy is one of the coolest tools in a chemist’s toolkit. It gives us a direct window into the molecular world, helping us solve structures, track reactions, and push the boundaries of medicine and biology.
Mastering the balance between the physical principles and the organic structures is the secret to cracking the IIT JAM chemistry paper. Take it one step at a time, practice regular problem-solving, and remember that resources are out there whenever you need a helping hand to cover Magnetic Resonance spectroscopy.
To know more in detail from our faculty, watch our YouTube video:
Frequently Asked Questions
Why do we prefer superconducting magnets in modern NMR instruments?
Superconducting magnets provide exceptionally strong and highly stable magnetic fields with zero electrical resistance when cooled with liquid helium. A stronger and more stable magnetic field directly improves the sensitivity of the instrument and gives you much better signal resolution, separating peaks that would otherwise overlap.
What is the Larmor frequency?
The Larmor frequency is the specific frequency at which a magnetic nucleus precesses around the direction of an external magnetic field. It matches the exact frequency of electromagnetic radiation required to cause a spin transition (or "flip") between nuclear energy levels.
How does the local chemical environment affect the NMR signal?
Electrons surrounding a nucleus circulate in the external magnetic field, creating a tiny, opposing local magnetic field. This effect is called shielding. If a nucleus is highly shielded, it feels a weaker net magnetic field and absorbs at a lower frequency. If it is next to an electronegative atom, it gets deshielded, feels a stronger net field, and absorbs at a higher frequency.
What is chemical shift, and why is it measured in ppm?
Chemical shift is the position on the NMR spectrum where a nucleus absorbs energy, measured relative to a reference standard (usually TMS). We measure it in parts per million (ppm) rather than Hertz (Hz) because ppm is independent of the operating frequency of the spectrometer. A peak at 2.0 ppm is always at 2.0 ppm, whether you run it on a 300 MHz or a 600 MHz machine.
Why is Tetramethylsilane (TMS) universally used as an internal standard?
TMS, Si(CH3)4, is ideal because its 12 hydrogens are chemically identical and highly shielded by the silicon atom, producing a single, sharp peak far away from most organic signals. This peak is arbitrarily set to 0 ppm. It is also chemically inert, volatile, and easy to remove from your sample afterward.
What causes peak splitting (spin-spin coupling) in a proton NMR spectrum?
Peak splitting happens because the magnetic moments of neighboring active nuclei interact with each other through chemical bonds. The spin state of a neighboring proton can either slightly add to or subtract from the local magnetic field felt by the proton you are looking at, breaking its signal into a multiplet.
What is the n+1 rule, and when does it apply?
The n+1 rule states that if a proton has n chemically equivalent neighboring protons on adjacent carbons, its NMR signal will split into n+1 peaks. This rule applies strictly when the chemical shift difference between the coupling nuclei is much larger than their coupling constant (J), which is typical for first-order spectra.
What is a coupling constant (J), and what does it tell us?
The coupling constant (J) is the distance between the split peaks of a multiplet, measured in Hertz (Hz). Unlike chemical shift, J is completely independent of the spectrometer's magnet strength. It tells you how strongly two sets of nuclei are interacting, which helps determine the spatial arrangement (like cis vs trans geometry) of neighboring atoms.
Can a nucleus couple with its own chemically equivalent neighbors?
No. Chemically equivalent protons do not show spin-spin splitting among themselves. For example, the six protons in ethane (CH3-CH3) are all equivalent, so they show up as a single, sharp singlet rather than splitting each other.
What is the Nuclear Overhauser Effect (NOE)?
NOE is the change in the intensity of one nuclear magnetic resonance signal when a nearby nucleus is saturated with radiofrequency radiation. Unlike spin-spin coupling, which works through chemical bonds, NOE operates directly through three-dimensional space, making it incredibly helpful for determining the stereochemistry and spatial proximity of atoms.
What is the difference between 1D and 2D NMR spectroscopy?
A standard 1D spectrum plots signal intensity against a single frequency axis (chemical shift). A 2D spectrum involves two frequency axes and plots intensity as a contour map. This allows you to see correlations directly—for example, COSY tells you which hydrogens are coupled to each other, while HSQC shows you exactly which carbon is attached to which hydrogen.
How can you identify a structural isomer using Magnetic Resonance spectroscopy?
Isomers have different structural arrangements, which leads to different symmetry and distinct chemical environments. For example, ortho-dichlorobenzene has two distinct chemical environments for its hydrogens and carbons, while para-dichlorobenzene has a high degree of symmetry, yielding far fewer peaks in both 1 H and 13C NMR spectra.