

The topic of the bacterial growth curve falls under the Microbial Physiology section of the official syllabus. It is a core area that examiners love to target, making it a crucial aspect of your microbiology preparation.
If you want to dive deep into the nitty-gritty of microbial physiology, standard textbooks like Microbiology by Pelczar or Prescott, and Microbial Physiology by Moat, Foster, and Spector are great references. These books give you a solid breakdown of how bacteria behave under different environmental conditions. Here at VedPrep, we always remind students that mastering this curve is one of the easiest ways to secure sure-shot marks in the exam.
Bacterial Growth Curve For IIT JAM: An Overview
Think of a bacterial growth curve as a financial chart tracking the lifecycle of a startup, but for bacteria living in a closed system like a batch culture (essentially a flask with a fixed amount of food). It shows you exactly how a bacterial population changes over time when it is left to its own devices.
Understanding the Bacterial growth curve helps you figure out how fast microbes multiply, when they are at their strongest, and when they start throwing in the towel. While you might hear about different types of growth patterns, three main setups pop up most often:
Exponential growth curve: The golden era where cells double at a constant, lightning-fast rate.
Linear growth curve: A steady, straight-line increase that you rarely see in a standard batch culture unless a specific nutrient is being fed at a fixed, slow rate.
Stationary growth curve: The plateau phase where the birth rate and death rate cancel each other out.
For competitive exams like IIT JAM, you need to know the four classic phases inside out: lag, log (exponential), stationary, and death.
Method of Obtaining Bacterial Growth Curve For IIT JAM
How do we actually get Bacterial growth curve in a lab? It is a straightforward, step-by-step process. You start by preparing a sterile liquid medium—like a nutrient broth—and introduce a tiny, fresh sample of bacteria (your inoculum).
The environment matters a lot. If you use a batch culture, it is a closed flask where no new food comes in and no waste goes out. If you use a continuous culture, it is an open system where fresh nutrients pump in constantly. For standard curve experiments, we stick to batch cultures.
Temperature control is a make-or-break factor here. If the incubator temperature drops or spikes too much, the bacterial enzymes stall, messing up your entire graph. To track the growth without counting billions of cells under a microscope, we use a spectrophotometer to measure optical density (OD) at regular intervals. As the liquid gets cloudier (more turbid), the OD reading goes up. When you plot the logarithm of these readings against time, your growth curve comes to life.
Phases of Bacterial Growth Curve For IIT JAM
Let’s break down the four phases using a relatable scenario to understand the Bacterial growth curve. Imagine you and your friends move into a new hostel room.
1. The Lag Phase
When you first step into that new hostel room, you don’t immediately start studying for IIT JAM. First, you unpack your bags, arrange your books, and figure out where the nearest food mess is. The bacteria do the exact same thing in the lag phase. They are not dividing yet, so the cell count barely moves. Instead, they are adapting to their new home, soaking up nutrients, growing in size, and cranking out the specific enzymes they need to digest the new food.
2. The Log (Exponential) Phase
Once you are totally settled in, you hit the books at maximum efficiency. For bacteria, the log phase is their peak performance era. Fuelled by abundant food, they divide as fast as they mathematically can. The population doubles at a constant rate, which gives you a beautiful, steep straight line when plotted on a log scale. This is the stage where bacteria are the most metabolically active and uniform, making them ideal for lab experiments.
3. The Stationary Phase
Eventually, reality kicks in. The hostel mess starts running low on your favorite snacks, and trash starts piling up in the corridor because nobody cleared it out. In the flask, nutrients run dry and toxic waste products accumulate. Welcome to the stationary phase. The rate of new bacterial cells being born perfectly matches the rate of old cells dying. The graph flattens out into a plateau. Cells also shrink and kick off survival strategies to brace for hard times.
4. The Death Phase
If nobody brings in new food or cleans up the toxic waste, the environment becomes completely unlivable. In the death phase, the cells lose their viability and die off exponentially. The curve takes a sharp downward turn.
Worked Example of the Bacterial growth curve: IIT JAM
Question: A culture of bacteria is inoculated into a fresh, nutrient-rich medium and incubated under its optimal temperature and pH. Describe what happens during the lag phase of their growth curve and why cell numbers don’t jump immediately.
Explanation & Key Points:
The lag phase is the introductory window where bacteria get a feel for their new surroundings.
Cell count stays flat: There is little to no increase in the actual number of cells.
High metabolic activity: Even though they aren’t dividing, they aren’t sleeping. They are actively synthesizing RNA, enzymes, and building blocks.
Variable duration: The length of this phase depends on how different the new medium is compared to their old home. If you move them from a rich broth to a poor synthetic medium, the lag phase will be much longer because they have to build new metabolic pathways from scratch.
Common Misconceptions About Bacterial Growth Curve
A classic trap that many IIT JAM aspirants fall into is thinking that every single bacterial growth curve out there looks like a perfect, smooth S-shape (sigmoidal curve). While the textbooks love showing you this classic shape, it only happens in a standard, closed batch culture. If you change the rules—like using a continuous culture setup where fresh nutrients keep dripping in—the bacteria can stay in the log phase indefinitely, and you will never see that classic plateau or crash.
Another big mistake is assuming the Bacterial growth curve only matters for passing your college practicals. In reality, these growth dynamics are the backbone of massive real-world industries.
Real-World Applications of Bacterial Growth Curve
Understanding how bacteria grow lets us manipulate them for awesome practical uses:
Industrial Fermentation: If a company wants to mass-produce life-saving insulin or biofuels, they need to know exactly when the bacteria hit their log phase to maximize production.
Environmental Monitoring: Environmental scientists use bacterial growth rates to check water quality. If toxic pollutants leach into a river sample, the bacterial growth curve will look warped or stunted compared to a clean control sample.
Medical Research: When scientists develop new antibiotics, they test them against bacteria in their log phase (when they are most vulnerable) and stationary phase (when they are toughest) to see how well the medicine actually works against infections.
Exam Strategy For Bacterial Growth Curve For IIT JAM
When you are staring down a microbiology question on exam day, you need a clear game plan. The examiners love asking about the mathematical side of this topic, specifically generation time (g) and growth rate constant (μ).
Make sure you are comfortable with the core formula:
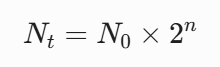
Where Nt is the final population size, N0 is the starting population, and n is the number of generations. Taking the log of this equation is how you calculate exactly how many times the population doubled over a specific period.
Pro Tip: Always read the question carefully to check if they are asking for the total time elapsed or the specific time it takes for the population to double once (generation time).
To get these formulas down from the Bacterial growth curve, practicing high-quality mock questions is key. Our team at VedPrep frequently organizes targeted practice sessions and provides crisp study materials designed to help you tackle these numerical problems without breaking a sweat.
Practice Questions and Answers
Test your understanding with these quick practice questions:
Q1. Why are log phase cells preferred for antibiotic susceptibility testing?
Answer: In the log phase, bacteria are rapidly growing and synthesizing new cell walls and proteins. Since most antibiotics target these active processes (like penicillin blocking cell wall synthesis), log-phase cells give the most accurate measure of an antibiotic’s true strength.
Q2. What happens to the lag phase if you transfer bacteria from a nutrient-poor medium to an identical nutrient-poor medium?
Answer: The lag phase will be extremely short or practically non-existent. Because the environment didn’t change, the bacteria already have all the necessary enzymes ready to go, so they can jump straight into dividing.
Q3. Name the phase where secondary metabolites (like penicillin) are usually produced.
Answer: Secondary metabolites are typically produced during the stationary phase, when nutrients run low and cells switch from active growth to defense and survival mode.
Final Thoughts
Mastering the bacterial growth curve is not just about memorizing the four phases for exam day; it is about training your brain to think like a microbiologist. Whether you are analyzing a tricky numerical on generation time or identifying a specific phase on a graph, clarity on these fundamentals will give you a massive edge in the IIT JAM exam. At VedPrep, we believe that breaking down these heavy academic topics into simple, logical pieces makes your preparation smooth and stress-free.
To know more in detail from our faculty, watch our YouTube video:
Frequently Asked Questions
Why do we plot the log of cell numbers instead of the actual cell count?
Bacteria multiply exponentially (1 becomes 2, then 4, 8, 16, and so on). If you use a regular linear scale, your graph will look like a flat line that suddenly shoots straight up into space, making it impossible to read. Converting the cell numbers into logarithms squashes that massive curve into a neat, easily readable straight line during the active growth period.
Does the bacterial growth curve always have to be sigmoidal (S-shaped)?
The classic S-shaped curve only happens in a batch culture—which is a closed system with a fixed amount of food. If you change the setup to a continuous culture where fresh media keeps dripping in and waste drops out, the bacteria can stay in the log phase indefinitely, completely skipping the stationary and death phases.
What are the four major phases you need to know for IIT JAM?
The big four are the lag phase (adaptation), the log or exponential phase (rapid division), the stationary phase (plateau due to limited resources), and the death or decline phase (population crash).
Why is there no increase in cell number during the lag phase?
Because the cells are busy adjusting to their new home. Think of it as prep work. Instead of dividing, they are actively taking in nutrients, growing larger, replicating their DNA, and cooking up the exact enzymes they need to digest the specific nutrients in that new flask.
Why is the log phase called the "exponential phase"?
During this window, the growth rate is entirely constant and maximal. The population doubles at fixed intervals. If you start with 100 cells, they become 200, then 400, then 800. Mathematically, this rapid, compounding growth is exponential.
Why do lab researchers prefer using cells from the log phase?
Log-phase cells are the most physically and chemically uniform. Since they are all living their best lives and dividing at the same rate, they give highly predictable and consistent results in experiments.
What triggers a bacterial culture to enter the stationary phase?
Two main things: the good stuff runs out, and the bad stuff builds up. The essential nutrients in the broth get depleted, and toxic metabolic waste products accumulate to a level that slows down cell division.
Are bacteria completely inactive during the stationary phase?
The population number stops growing simply because the birth rate equals the death rate. Individually, many cells are highly active—they just shift their energy away from replication and toward survival, often producing protective structures or antibiotics.
What are secondary metabolites, and when are they produced?
Secondary metabolites are compounds produced by microbes that aren't essential for basic growth but help them survive. Classic examples include antibiotics like penicillin. Bacteria produce these during the stationary phase to kill off competing microbes when resources get tight.
What is a "batch culture"?
A batch culture is a closed culture system. You put a set amount of nutrient broth into a flask, inoculate it with bacteria, plug it, and let it ride under optimal conditions. No extra food is added, and no waste is removed.
How does a continuous culture differ from a batch culture?
A continuous culture is an open system. Fresh nutrient medium is constantly pumped into the vessel, while an equal amount of spent medium and old cells are siphoned out. This keeps the nutrients constant and allows the bacteria to grow continuously in the log phase.
What is a chemostat?
A chemostat is a specific type of continuous culture device. It controls the growth rate of the bacteria by keeping the concentration of one limiting nutrient (like carbon or nitrogen) at a constant, fixed level.
How do we measure bacterial growth without counting cells one by one?
We look at the turbidity (cloudiness) of the liquid culture using a spectrophotometer. The machine shines a light through the sample and measures the Optical Density (OD). More cells mean more cloudiness, which blocks more light and gives a higher OD reading.
Does optical density distinguish between live and dead cells?
No, and this is a classic exam trap! A spectrophotometer measures anything that scatters light. In the death phase, even though cells are dying and losing viability, they still look like particles in the liquid, so the OD reading might drop very slowly compared to the actual drop in live cells.