

Understanding the levels of species diversity and its measurement is a cornerstone of the Ecology and Conservation Biology unit. As the competition for the Junior Research Fellowship (JRF) and Lectureship intensifies, mastering the intricate patterns of biodiversity becomes essential for every serious aspirant. Species diversity is not merely a count of organisms; it is a sophisticated reflection of ecosystem health, stability, and evolutionary history.
In the upcoming CSIR NET exam, the National Testing Agency (NTA) frequently tests candidates on their ability to differentiate between various scales of diversity and apply mathematical indices to quantify them. This guide provides an exhaustive breakdown of alpha, beta, and gamma diversity—the three primary pillars in the levels of species diversity and its measurement. Whether you are calculating the Shannon-Wiener index or analyzing species turnover across fragmented landscapes, a conceptual grasp of these levels is non-negotiable.
Syllabus – Biodiversity and Conservation for CSIR NET: Levels of Species Diversity and Its Measurement
The topic levels of species diversity and its measurement falls under the unit Biodiversity and Conservation of the CSIR NET syllabus, which is officially provided by the National Testing Agency (NTA).
This unit is a major score-booster in Part C, where analytical questions dominate. To build a rock-solid foundation, you can refer to standard textbooks like:
-
Ecology by Eugene P. Odum
-
Environmental Science by A.D. Ahuja
While these textbooks provide full coverage of biodiversity, wrestling with dense academic text right before the exam can feel overwhelming. That is why we at VedPrep have broken down these standard ecological theories into practical, exam-oriented frameworks to simplify complex quantifying techniques. As per levels of species diversity and its measurement, transitioning from basic richness to relative abundance, we will explore how these measurements inform conservation strategies and global biodiversity monitoring. Let’s dive into the numerical and theoretical framework of levels of species diversity and its measurement to ensure your preparation is both comprehensive and result-oriented.
Understanding Levels of Species Diversity and Its Measurement For CSIR NET
Species diversity just means the variety of different species living in a specific area. But in the CSIR NET exam, the NTA wants you to think like a field ecologist, not just someone memorizing a vocabulary list. To understand levels of species diversity and its measurement, we use a framework introduced by R.H. Whittaker, which divides diversity into three spatial scales: Alpha (α), Beta (β), and Gamma (γ).
Let’s break them down using a quick, fictional scenario to make this concrete:
Imagine this scenario: Imagine you are surveying a mountain range with three distinct valleys.
-
Valley 1 is a damp, shaded forest.
-
Valley 2 is a dry, sun-drenched grassland.
-
Valley 3 is a rocky alpine meadow.
Alpha Diversity (α-diversity)
This is local diversity. It measures the species richness (the total number of species) and evenness (how equally individuals are distributed among those species) within a single, small community or habitat.
-
In our scenario: If you sit down in the Valley 1 forest and count 15 different species of beetles right there under the canopy, that count represents your alpha diversity for that specific habitat.
Beta Diversity (β-diversity)
This is all about species turnover—the rate at which species change when you move from one habitat to another. It highlights how unique communities are. If two habitats share the exact same species, beta diversity is zero. If they have completely different species, beta diversity is high.
-
In our scenario: If you walk out of the Valley 1 forest and into the Valley 2 grassland, and find an entirely new set of beetles that can’t survive in the shade, you are observing high beta diversity between those two communities.
Gamma Diversity (γ-diversity)
This is regional diversity. It looks at the big picture by measuring the total species diversity across an entire landscape or geographic region that contains multiple ecosystems.
-
In our scenario: If you combine your species lists from all three valleys—subtracting any species that overlap—the total number of unique beetle species across the entire mountain range is your gamma diversity.
Worked Example: Levels of species diversity and its measurement For CSIR NET
CSIR NET Part C loves numerical problems based on Whittaker’s diversity scales. Let’s look at a typical problem style you might face on exam day.
Question
The following table represents the presence (1) or absence (0) of four different plant species across three distinct ecosystems: a Forest, a Grassland, and a Desert. Calculate and compare the local alpha diversity for each ecosystem, and determine the regional gamma diversity for the entire landscape.
| Ecosystem | Species 1 | Species 2 | Species 3 | Species 4 | Total Species (α) |
| Forest | 1 | 1 | 1 | 1 | 4 |
| Grassland | 1 | 1 | 0 | 0 | 2 |
| Desert | 1 | 0 | 0 | 0 | 1 |
Solution
1. Alpha Diversity Calculation
Alpha diversity is simply the count of species within each separate ecosystem:
-
Forest α: 4 species (Species 1, 2, 3, 4)
-
Grassland α: 2 species (Species 1, 2)
-
Desert α: 1 species (Species 1)
Takeaway: The Forest has the highest alpha diversity, while the Desert has the lowest.
2. Gamma Diversity Calculation
Gamma diversity is the total number of unique species across the whole region. Looking at the columns, Species 1, 2, 3, and 4 all appear at least once across the landscape.
3. Beta Diversity Context
While there are a few mathematical formulas for beta diversity (like Whittaker’s original ![]() ), the conceptual takeaway here is species turnover. Based on levels of species diversity and its measurement, notice that the Grassland and Desert don’t introduce any new unique species—they are just simplified subsets of the Forest. Because of this, the species turnover (beta diversity) across this landscape is driven entirely by the drop-out of species as conditions get harsher, rather than the appearance of new, specialized organisms.
), the conceptual takeaway here is species turnover. Based on levels of species diversity and its measurement, notice that the Grassland and Desert don’t introduce any new unique species—they are just simplified subsets of the Forest. Because of this, the species turnover (beta diversity) across this landscape is driven entirely by the drop-out of species as conditions get harsher, rather than the appearance of new, specialized organisms.
Common Misconceptions About Levels of Species Diversity and Its Measurement For CSIR NET
When studying levels of species diversity and its measurement, it is easy to trip over a few common traps. At VedPrep, we see students make these two mistakes all the time:
-
Misconception 1: “Species richness and alpha diversity are the exact same thing.” Not quite. Species richness is just a raw headcount of different species. Alpha diversity is a broader concept that often includes evenness (relative abundance). Imagine two ponds. Pond A has 99 goldfish and 1 catfish (Richness = 2). Pond B has 50 goldfish and 50 catfish (Richness = 2). Their richness is identical, but Pond B has much higher alpha diversity because its community is balanced and even.
-
Misconception 2: “Biodiversity studies only matter in pristine tropical rainforests.” NTA loves testing your ability to apply these metrics to heavily disturbed, temperate, or extreme environments like deserts and agricultural fields. The mathematical laws of diversity apply everywhere, whether you are tracking a coral reef or soil microbes in a city park.
Application of Levels of Species Diversity and Its Measurement For CSIR NET
Why do conservation biologists care about these numbers? Because they tell us exactly where to spend limited conservation budgets.
Imagine this scenario: A conservation agency has enough funding to buy and protect only two patches of land. They are looking at two different options:
-
Option A: Three patches of woodland that each have an alpha diversity of 30 species. However, they all contain the exact same 30 species (β-diversity is zero).
-
Option B: Three patches of rocky scrubland that only have an alpha diversity of 15 species each. But, because of microclimates, each patch contains entirely unique species (β-diversity is incredibly high).
If the agency only looked at alpha diversity, they would pick Option A. But if they look at the big picture, protecting Option B preserves a much higher regional gamma diversity. Understanding levels of species diversity and its measurement helps scientists design wildlife corridors, map out protected reserves, and monitor how ecosystems recover after wildfires or logging.
Levels of species diversity and its measurement For CSIR NET: A Detailed Analysis
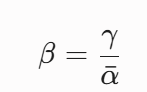
To tackle Part C questions confidently, you need to understand how alpha, beta, and gamma diversity interact mathematically. Whittaker proposed a simple relationship to tie these levels together:
Species diversity is a critical component of biodiversity. Its measurement is essential in ecology and conservation biology, particularly for Levels of species diversity and its measurement For CSIR NET. Species diversity indices are used to quantify the variety of species present in a community.
For CSIR NET, it is critical to understand the different indices. Simpson, Shannon, and Margale findices are commonly used; these indices take into account the number of species present and their relative abundance, which is crucial for Levels of species diversity and its measurement For CSIR NET.
Where:
-
γ is the total regional diversity.
-
 is the average alpha diversity across all the sampled local communities.
If you rearrange this formula, you can easily calculate missing values when the exam gives you two of the variables. Keep in mind that high beta diversity means that local habitats are highly specialized and distinct from one another. If human activities fragment a landscape, it can artificially alter these balances, causing generalist species to take over and causing beta diversity to plummet across the region.
Quantifying Levels of Species Diversity: Methods and Techniques For CSIR NET
You can expect to see formulas on your exam paper. When it comes to levels of species diversity and its measurement, the two absolute heavyweight indices you must memorize are the Shannon-Wiener Index and Simpson’s Index.
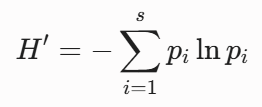
1. Shannon-Wiener Index (H’)
This index measures the uncertainty in predicting the species identity of an individual picked at random from a sample. If a community has high diversity and high evenness, it’s tough to guess what species you’ll pull out, giving you a high H’ value.
Where:
-
s = total number of species
-
pi = proportion of individuals belonging to the i-th species (ni / N)
2. Simpson’s Index (D)
This index measures probability. It looks at the likelihood that any two individuals picked at random from the community belong to the same species.
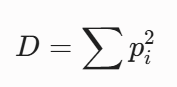
Because $D$ goes down as diversity goes up, ecologists usually calculate Simpson’s Index of Diversity (1 – D) or the Reciprocal Index (1/D) so that a higher score actually represents a more diverse community.
3. Margalef’s Richness Index (Dmg)
If you just want to look at species richness while adjusting for the total sample size, use Margalef’s index:
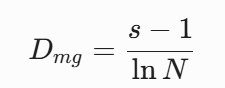
Where N is the total number of individuals across all species.
Case Study: Conservation of Species Diversity in a Fragmented Landscape For CSIR NET
Let’s look at a real-world classic example that often inspires NTA exam questions from levels of species diversity and its measurement: habitat fragmentation in the Atlantic Forest (Serra do Mar region) of Brazil.
Originally, this region was a continuous, massive rainforest with high alpha diversity in every patch and a steady beta diversity across the landscape. However, agriculture and urbanization broke the forest into isolated “islands” or fragments.
When a landscape is fragmented like this, ecotone effects (edge effects) increase. The interior specialists—like deep-forest birds and delicate orchids—die out in the smaller patches, lowering the alpha diversity of those individual fragments. Meanwhile, weed-like generalist species invade the edges of every single fragment. Because every patch starts looking identical, the species turnover ($\beta$-diversity) across the landscape drops dramatically, causing a massive collapse in total regional gamma diversity.
Understanding how fragmentation shifts these metrics is exactly the kind of analytical thinking that will earn you 4 marks in Part C.
Key Points to Remember for CSIR NET: Levels of Species Diversity and Its Measurement For CSIR NET
-
Alpha (α) is local, Beta (β) is the difference between sites, and Gamma (γ) is regional landscape diversity.
-
Whittaker’s basic relationship:

-
Shannon-Wiener Index (H’) focuses on rare species and evenness; a higher value means a more diverse ecosystem.
-
Simpson’s Index (D) heavily weighs dominant species; always check whether a question asks for D, 1-D, or 1/D.
-
Habitat fragmentation typically reduces both local alpha diversity and landscape beta diversity over time due to edge effects and community homogenization.
Conclusion
The study of levels of species diversity and its measurement is not just an academic requirement; it is a vital tool for assessing the impact of human activities on our planet. In an era of rapid climate change and habitat loss, the ability to accurately quantify species richness and evenness across different spatial scales is indispensable.
Mastering the levels of species diversity and its measurement for the upcoming exam cycle is not just about memorizing formulas; it is about understanding how life organizes itself across different scales. By cleanly distinguishing between alpha, beta, and gamma diversity, you can confidently tackle the analytical and numerical questions that frequently appear in the Ecology unit. As you refine your preparation, VedPrep is here to support your journey with expert-led insights, practice workbooks, and comprehensive study materials tailored for success. Consistent practice with diversity indices will ensure you are well-equipped to secure a top rank.
To know more in detail from our faculty, watch our YouTube video:
Frequently Asked Questions
How is species diversity measured?
Species diversity is measured using indices such as the Shannon-Wiener index, Simpson index, and species richness. These indices consider factors like species abundance and evenness.
What is alpha diversity?
Alpha diversity refers to the species richness within a specific habitat or community. It is often measured by counting the number of species present.
What is beta diversity?
Beta diversity measures the variation in species composition between different habitats or communities. It helps understand how species change across different environments.
What is gamma diversity?
Gamma diversity refers to the total species richness across a large geographical area, encompassing multiple habitats and communities.
What is the importance of species diversity?
Species diversity is essential for maintaining ecosystem health, resilience, and functioning. It provides various ecosystem services and supports human well-being.
How does species diversity relate to community ecology?
Species diversity is a fundamental concept in community ecology, as it helps understand community structure, dynamics, and interactions.
How is species diversity relevant to CSIR NET?
Understanding species diversity and its measurement is crucial for the CSIR NET exam, as it is a key concept in ecological principles and community ecology.
What are some common questions related to species diversity in CSIR NET?
Common questions include calculating species diversity indices, interpreting diversity patterns, and understanding the implications of diversity on ecosystem functioning.
What are common mistakes in measuring species diversity?
Common mistakes include ignoring species abundance, failing to account for sampling effort, and misinterpreting diversity indices.
How can one avoid errors in calculating diversity indices?
To avoid errors, ensure accurate species identification, consider multiple diversity indices, and account for sample size and effort.
What are some advanced concepts in species diversity?
Advanced concepts include phylogenetic diversity, functional diversity, and the use of machine learning algorithms to analyze diversity patterns.
How is species diversity related to ecosystem services?
Species diversity is linked to various ecosystem services, including pollination, pest control, and nutrient cycling, which are essential for maintaining ecosystem health.
What are some emerging trends in species diversity research?
Emerging trends include the use of genomics, remote sensing, and big data analytics to study diversity patterns and understand ecosystem dynamics.
What are some applications of species diversity in conservation biology?
Applications include identifying areas of high conservation value, developing effective conservation strategies, and monitoring ecosystem health.