

Regression and Correlation For CSIR NET is a critical statistical tool for analyzing relationships between variables, enabling students to identify patterns, make predictions, and understand data trends. It’s a fundamental concept in data analysis, widely applied in research and competitive exams.
Understanding Regression and Correlation For CSIR NET Syllabus and Key Textbooks
If you are gearing up for the CSIR NET exam, you already know that the Statistics and Probability unit isn’t something you can just skip over. Right at the heart of this unit sits a massive topic: Regression and Correlation.
Think of it this way: Regression and Correlation is like noticing that whenever your friend orders an extra shot of espresso, their talking speed doubles. You are measuring how two things move together. Regression, on the other hand, goes a step further. It is like trying to guess exactly how fast they will talk based on the number of ounces of caffeine they drank. One tracks the relationship; the other tries to predict the future based on it.
To really nail this section, relying on your old college notes might not cut it. You will want some solid books on your desk. Here are a couple of classics that break things down beautifully:
Statistics for Economics by S. C. Kak
Probability and Statistics by E. S. S. S. Yadav
These books are gold mines for exams like CSIR NET, IIT JAM, and GATE because they don’t just throw formulas at you; they build up your core logic from scratch.
Regression and Correlation For CSIR NET: Definition and Types
Let’s strip away the heavy math jargon for a second. When we talk about Regression and Correlation, we are basically playing detective with data.
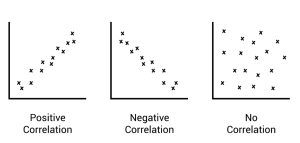
With correlation, your main tool is the correlation coefficient, usually just called r. This little number tells you the direction and strength of a straight-line relationship between two things. It lives strictly between -1 and 1:
r = 1: Perfect teamwork. One goes up, the other goes up in perfect lockstep.
r = -1: Perfect opposites. One goes up, the other tanks.
r = 0: Complete chaos. The two variables don’t care about each other at all.
Now, regression takes that relationship and builds a predictive machine. You have an independent variable (the one you control or observe, like study hours) and a dependent variable (the outcome you want to forecast, like your test score).
Depending on how many pieces of data you are tracking, you will generally deal with two types:
Simple Linear Regression: You use just one independent variable to guess the outcome.
Multiple Linear Regression: You bring in multiple independent variables to get a more accurate picture.
Solved Example: Regression and Correlation For CSIR NET
Let’s look at a realistic problem type you might see on an exam paper. Imagine we tracked the marks of 5 students in Mathematics (X) and Statistics (Y).
| Mathematics (X) | Statistics (Y) |
| 10 | 8 |
| 15 | 12 |
| 20 | 15 |
| 25 | 18 |
| 30 | 20 |
Let’s find out how these scores relate by calculating the correlation coefficient (r) and the regression line of Y on X to understand Regression and Correlation.
Step 1: Set up your summation table
To make our lives easier, let’s calculate the necessary building blocks: X2, Y2, and XY.
| X | Y | X2 | Y2 | XY |
| 10 | 8 | 100 | 64 | 80 |
| 15 | 12 | 225 | 144 | 180 |
| 20 | 15 | 400 | 225 | 300 |
| 25 | 18 | 625 | 324 | 450 |
| 30 | 20 | 900 | 400 | 600 |
| ∑X = 100 | ∑Y = 73 | ∑X2 = 2250 | ∑Y2 = 1157 | ∑XY = 1610 |
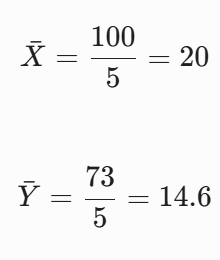
We also have n = 5 students. The means are:
Step 2: Calculate the Correlation Coefficient (r)
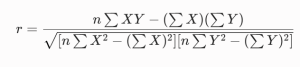
We use the standard Pearson formula:
Let’s plug in the numbers:
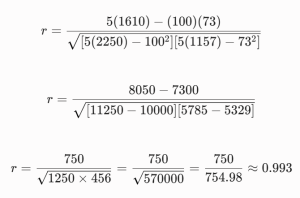
An r value of 0.993 tells us there is a incredibly strong positive relationship between doing well in Math and doing well in Stats.
Step 3: Find the Regression Equation of Y on X
The line equation looks like Y = a + bX, where b is the slope and a is the intercept.
First, let’s find the slope (b):
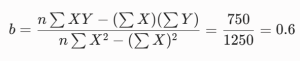
Next, let’s find the y-intercept (a):

So, your final regression equation is:
Common Misconceptions About Regression and Correlation For CSIR NET
Here is where a lot of smart students trip up during the actual exam.
The biggest trap is mixing up correlation with causation. Let’s look at a quick, fictional scenario to show why this matters. Imagine a researcher looks at data from coastal cities and finds a massive positive correlation between ice cream sales and sunscreen sales. Whenever ice cream sales spike, sunscreen sales shoot through the roof. If you assume causation here, you might say buying ice cream causes people to buy sunscreen. The hidden factor driving both is just a hot, sunny day. Regression and Correlation only shows that two numbers dance together; it doesn’t mean one is leading the dance.
Another mix-up is treating regression and correlation like they are the exact same thing. They are close relatives, but they have different jobs. Correlation gives you a single index value (r) showing how tightly two variables cling together. Regression gives you a full functional model (Y = a + bX) so you can map out predictions.
Finally, don’t think multiple regression is just a bunch of separate simple regression equations stacked on top of each other. It is a single, unified system that balances multiple factors at the exact same time so your final prediction doesn’t double-count overlapping information.
Real-World Application of Regression and Correlation For CSIR NET
These aren’t just abstract ideas invented to make competitive exams harder. They run the world behind the scenes.
Finance: Wall Street analysts love regression. They use it to see how a stock price reacts to things like inflation updates, changing interest rates, or GDP shifts.
Medicine: Imagine medical researchers trying to figure out how well a new blood pressure medication works. They will use regression to find the sweet spot for dosage while using multiple regression to control for a patient’s age, weight, and lifestyle habits.
Social Sciences: Want to understand the link between a neighborhood’s average education level and life expectancy? Correlation helps researchers see if a link exists, and regression helps map out what that trend looks like over time.
Exam Strategy for Regression and Correlation For CSIR NET
When you are sitting in the exam hall, time is your scarcest resource. At VedPrep , we always remind students that you don’t need to overcomplicate your approach to this topic. Focus your energy on the areas that show up year after year: simple linear regression derivations, properties of the correlation coefficient, and how the coefficient of determination (R2) works.
Here is a quick game plan to help focus your study sessions:
Own the properties: Don’t just learn how to calculate r. Know what happens to it if you scale or shift the data points (hint: it’s invariant to changes of origin and scale!).
Read between the lines: Make sure you can interpret what a slope coefficient actually means in plain English, not just as a letter in a formula.
Watch the boundaries: Keep a close eye on the assumptions like linearity and homoscedasticity. The exam loves to ask conceptual questions about when these models break down.
VedPrep’s resources can help candidates master these areas and excel in the exam.
Interpretation of Regression and Correlation For CSIR NET Results
Once you run the numbers and get your results, what do they actually mean?
Let’s break down the regression line equation again to evaluate Regression and Correlation:
Here, b is the real star of the show. It’s the slope. If b = 0.6 in our earlier math and stats example, it means that for every extra 1 mark a student gets in Mathematics, you can expect their Statistics score to climb by 0.6 marks. The a value is your intercept—the baseline value of y if x were a flat zero.
But remember the fine print! Your regression model is only as good as the assumptions behind it. If your data points look like a wild horseshoe shape on a graph instead of a straight line, trying to force a linear regression model onto it will give you completely useless predictions.
Tips for Solving Regression and Correlation For CSIR NET Problems
When you are tackling these questions under exam pressure, a systematic approach saves you from silly calculation errors.
Map out your data early: As soon as you see a dataset, build a clean table for ∑X, ∑Y, ∑X2, ∑Y2, and ∑XY. Most calculation errors happen because someone rushed this step.
Sanity check your r value: If you run your calculations and end up with an r = 1.2, stop immediately. You made a math error somewhere, because r can never cross over 1.
Think about context: Always ask yourself if your final equation makes sense. If your slope value says that studying more hours leads to a lower exam score, go back and double-check your signs.
We find that breaking down problems step-by-step this way makes the whole process feel much less overwhelming. At VedPrep, our goal is to help you look at a page full of messy data and instantly see the clean structure hidden underneath.
Advanced Topics in Regression and Correlation For CSIR NET
Once you have mastered the basics, you will want to explore the advanced territory that frequently separates the top tier scores from the rest of the pack.
Multiple and Non-Linear Models
Real-world data is rarely perfectly simple. Sometimes variables curve, requiring non-linear regression models like exponential, logarithmic, or polynomial equations. Other times, you need to weigh a whole panel of factors at once using multiple regression.
Time Series Analysis
When data points are tracked sequentially over time—like tracking a stock price every hour or monitoring temperature changes across weeks—standard regression needs an upgrade. That’s where time series analysis comes into play.
| Technique | Description |
| Autoregression | Predicts future trends by looking back at your own past data points. |
| Moving Average | Uses the history of past prediction errors (residuals) to smooth out and forecast upcoming values. |
Final Thoughts
Mastering Regression and Correlation for CSIR NET isn’t about mindless memorization or frantically writing formulas on cheat sheets. It is about learning to read the underlying story that data is trying to tell you. By keeping your practice consistent, understanding the core assumptions, and keeping a cool head, you can turn this section of the syllabus into a major point-earner on exam day.
To know more in detail from our faculty, watch our YouTube video:
Frequently Asked Questions
What is correlation analysis?
Correlation analysis is a statistical method used to determine the strength and direction of the relationship between two variables. It provides a numerical value, known as the correlation coefficient, which ranges from -1 to 1.
What is the difference between correlation and regression?
Correlation analysis determines the strength and direction of the relationship between variables, whereas regression analysis predicts the value of a continuous outcome variable based on one or more predictor variables.
What are the types of regression?
There are several types of regression, including simple linear regression, multiple linear regression, polynomial regression, and logistic regression. Each type is used to model different types of relationships between variables.
What is the coefficient of determination?
The coefficient of determination, also known as R-squared, measures the proportion of the variance in the dependent variable that is predictable from the independent variable(s) in a regression model.
What are the assumptions of regression analysis?
The assumptions of regression analysis include linearity, independence, homoscedasticity, normality, and no multicollinearity. These assumptions must be met to ensure the validity and reliability of the regression model.
What are statistical methods?
Statistical methods are techniques used to collect, analyze, and interpret data. In biology, statistical methods are used to test hypotheses, make informed decisions, and draw conclusions from data.
What is the importance of regression and correlation in biology?
Regression and correlation are essential statistical methods in biology to analyze and interpret data, test hypotheses, and make informed decisions. They help researchers understand the relationships between variables and make predictions.
How to apply regression and correlation in CSIR NET?
In CSIR NET, regression and correlation are applied to analyze and interpret data in various biological contexts. Understanding the concepts and methods of regression and correlation is essential to solve problems and answer questions in the exam.
What are the important topics to focus on for CSIR NET?
Important topics to focus on for CSIR NET include types of regression, correlation coefficients, coefficient of determination, assumptions of regression analysis, and applications of statistical methods in biology.
What are common mistakes in regression analysis?
Common mistakes in regression analysis include ignoring assumptions, using the wrong type of regression, not checking for multicollinearity, and misinterpreting coefficients. Being aware of these mistakes can help ensure accurate and reliable results.
How to avoid errors in correlation analysis?
To avoid errors in correlation analysis, it is essential to ensure that the data meets the assumptions of correlation analysis, use the correct type of correlation coefficient, and interpret the results in the context of the research question.
What is multivariate regression?
Multivariate regression is a type of regression analysis that involves more than one independent variable. It is used to model the relationship between multiple independent variables and a continuous outcome variable.
What are non-parametric regression methods?
Non-parametric regression methods are used when the relationship between variables is not linear or when the data does not meet the assumptions of traditional regression analysis. Examples include kernel regression and spline regression.
What is the role of machine learning in regression and correlation?
Machine learning algorithms can be used to improve regression and correlation analysis by handling complex data sets, identifying non-linear relationships, and providing more accurate predictions.