
Mean and standard deviation are statistical measures used to quantify the central tendency and dispersion of data. For CSIR NET, students need to understand these concepts to analyze and interpret data in various fields, including physics, chemistry, and mathematics.
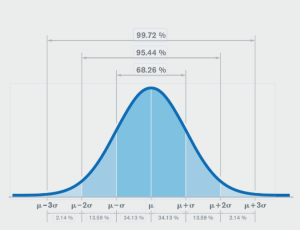
These two concepts form the bedrock of descriptive statistics. Whether you are aiming for Junior Research Fellowship (JRF) or Lectureship in Chemical, Physical, or Life Sciences, you will encounter data analysis questions where these tools are non-negotiable. Let’s break them down in a way that actually makes sense, without the heavy academic jargon.
Syllabus: Mean and standard deviation For CSIR NET
The topic of Mean and standard deviation For CSIR NET falls squarely under the “Probability and Statistics” section of the official syllabus, listed as Unit 12: Statistical methods. This unit covers the essential tools you need to make sense of experimental data, and Mean and standard deviation are at the very top of that list.
Probability and statistics isn’t just a hurdle for the CSIR NET; it is also a staple in IIT JAM, CUET PG, and GATE. These exams love to test your understanding of statistical analysis, regression, and probability distributions. To get those high marks, you should focus on how these formulas are derived and, more importantly, how they apply to practical scientific scenarios.
Concept of Mean and Standard Deviation For CSIR NET
Let’s look at the Mean and standard deviation from a practical perspective.
The mean is just the average. You add up all your data points and divide by the total number of points. It gives you a single, central value that represents the “middle” of your dataset.
The standard deviation, on the other hand, tells you about the spread. It measures how far your data points are drifting away from that central mean.
-
Low standard deviation: The data points are tightly clustered around the mean.
-
High standard deviation: The data points are scattered far and wide.
Imagine a fictional scenario where two CSIR NET aspirants, Amit and Priya, are practicing their daily mock tests. Let’s look at their scores over five days:
-
Amit’s scores: 38, 39, 40, 41, 42
-
Priya’s scores: 20, 30, 40, 50, 60
Both Amit and Priya have an average (mean) score of 40. But Amit’s standard deviation is very low because his scores are consistent and close to 40. Priya’s standard deviation is quite high because her scores are wildly volatile.
Worked Example: Calculating Mean and Standard Deviation For CSIR NET
Let’s get our hands dirty with some actual math. Don’t worry, we will keep it straightforward.
Suppose you run a laboratory experiment and get this small dataset: {1, 2, 3, 4, 5}.
Step 1: Find the Mean (μ)
To find the mean, add the values together and divide by the total number of points (N).
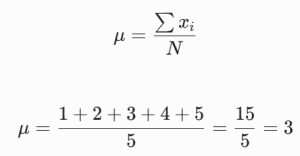
The mean of our dataset is 3.
Step 2: Find the Standard Deviation (σ)
Now, we want to see how much our data points vary from that mean of 3. Here is the step-by-step breakdown:
| Data Point (x) | Deviation from Mean (x−μ) | Squared Deviation (x−μ)2 |
| 1 | 1 – 3 = -2 | 4 |
| 2 | 2 – 3 = -1 | 1 |
| 3 | 3 – 3 = 0 | 0 |
| 4 | 4 – 3 = 1 | 1 |
| 5 | 5 – 3 = 2 | 4 |
Now, we add up those squared deviations: 4 + 1 + 0 + 1 + 4 = 10.
For a sample standard deviation, we use the formula:
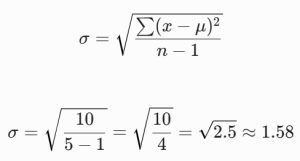
(Note: If you are calculating the standard deviation for an entire population where you divide by N instead of n-1, the result would be √10/5 = √2≈ 1.41. Always read the exam question carefully to see if they are asking for sample or population metrics!)
Common Misconceptions About Mean and Standard Deviation For CSIR NET
A classic trap for students is mixing up the mean and the median. The mean is the calculated average of every single value. The median is literally just the middle number when you line them all up from smallest to largest.
Another major thing to watch out for is outliers. Imagine five research labs reporting data, and four of them get values around 10, while one rogue lab reports 500 because of an equipment glitch. That single 500 will skyrocket your mean and blow up your standard deviation.
When you encounter skewed data in the exam, remember that the mean and standard deviation get pulled heavily by outliers, whereas the median stays relatively safe.
Applications of Mean and Standard Deviation in Real-World Scenarios
Why do we care so much about Mean and standard deviation? Because they are used everywhere outside the exam hall.
-
Finance: Investors look at the mean return of a stock to see how much money it makes on average. They look at the standard deviation to calculate the risk.
-
Medicine: When scientists test a new drug, they look at the mean reduction in symptoms across patients. The standard deviation tells them if the drug works consistently for everyone, or if it only works wonders for a few while doing nothing for the rest.
-
Quality Control: Think about a factory manufacturing paracetamol tablets. The mean weight of the tablets must be exact, and the standard deviation needs to be near zero.
Exam Strategy: Mastering Mean and Standard Deviation For CSIR NET
To ace this section in CSIR NET, IIT JAM, or GATE, you need to move past simple rote memorization.
-
Visualize the data: Don’t just stare at the numbers. Try to picture how they sit on a bell curve.
-
Watch the wording: Keep an eye out for whether a question asks for sample variance (n-1 in the denominator) or population variance (n in the denominator).
-
Practice with real exam papers: Theory is great, but speed comes from solving actual problems under a clock.
At VedPrep , we have designed our mock tests and study materials to replicate the exact style of statistical questions you will face on exam day, helping you build both accuracy and speed.
Use VedPrep’s study materials and resources to supplement learning and stay ahead of the competition, particularly for Mean and standard deviation For CSIR NET.
Key Formulas and Theorems for Mean and Standard Deviation For CSIR NET
Here is a quick cheat sheet you can copy into your revision notes:
-
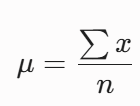
Population Mean:
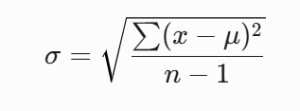
- Sample Standard Deviation:
- Variance: This is simply the square of the standard deviation (σ2). While standard deviation gives you the spread in the original units of your data, variance is used for more advanced algebraic calculations.
Final Thoughts
In physics, you will use them to calculate experimental error and measurement uncertainties. In chemistry, they help you assess the precision of your titrations and analytical methods.
Instead of treating this topic like an annoying math requirement, look at it as the language of experimental science. Once you understand how to read the central point and the spread of data, you are well on your way to securing those crucial marks in Unit 12.
To know more in detail from our faculty, watch our YouTube video:
Frequently Asked Questions
What is standard deviation?
Standard deviation measures the amount of variation or dispersion in a set of values. A low standard deviation indicates that values tend to be close to the mean, while a high standard deviation indicates that values are spread out.
How are mean and standard deviation related?
The mean and standard deviation are related in that the standard deviation is calculated from the mean. The standard deviation measures the variability of the data points around the mean value.
What is the formula for calculating mean?
The formula for calculating the mean is: mean = (sum of all values) / (number of values). This is also known as the arithmetic mean.
What is the formula for calculating standard deviation?
The formula for calculating standard deviation is: σ = √[(Σ(xi - μ)2) / (n - 1)], where σ is the standard deviation, xi are individual data points, μ is the mean, and n is the number of data points.
What is the importance of mean and standard deviation in Physical Chemistry?
In Physical Chemistry, mean and standard deviation are crucial for data analysis and interpretation. They help researchers understand the behavior of chemical systems, identify trends, and make informed decisions.
How are mean and standard deviation used in data analysis?
Mean and standard deviation are used to summarize and describe datasets, identify outliers, and make inferences about populations. They are essential tools for data analysis and interpretation.
What is the difference between population and sample mean and standard deviation?
The population mean and standard deviation describe the entire population, while the sample mean and standard deviation describe a subset of the population. The sample mean and standard deviation are used to estimate the population parameters.
How are mean and standard deviation applied in CSIR NET Physical Chemistry?
In CSIR NET Physical Chemistry, mean and standard deviation are applied to analyze and interpret data from experiments and simulations. They help researchers evaluate the accuracy and precision of their results.
What types of questions are asked about mean and standard deviation in CSIR NET?
CSIR NET Physical Chemistry questions may involve calculating mean and standard deviation, interpreting data, and applying statistical concepts to analyze chemical systems.
What are common mistakes when calculating mean and standard deviation?
Common mistakes include incorrect calculation of the mean, failure to use the correct formula for standard deviation, and not accounting for outliers or missing data.
How can I avoid mistakes when interpreting mean and standard deviation?
To avoid mistakes, ensure that you understand the assumptions underlying the calculations, consider the context of the data, and avoid over-interpreting results.
What are some advanced applications of mean and standard deviation in Physical Chemistry?
Advanced applications include using mean and standard deviation to analyze complex systems, model chemical reactions, and evaluate the performance of computational models.
How can I use mean and standard deviation to analyze non-normal data?
For non-normal data, alternative measures of central tendency and dispersion, such as the median and interquartile range, may be more suitable. Robust statistical methods can also be used.
What are some limitations of mean and standard deviation?
Limitations include sensitivity to outliers, assumption of normality, and failure to capture complex relationships between variables. Alternative statistical methods may be necessary.