

Acid-base titrations For IIT JAM involve the neutralization of acids and bases to determine their concentrations, using indicators and pH monitoring to reach the equivalence point, a crucial concept in Physical Chemistry for competitive exams.
Syllabus: Acid-base titrations: IIT JAM Physical Chemistry Syllabus Unit 2
If you are prepping for IIT JAM, you already know that Unit 2 of the Physical Chemistry syllabus holds some serious weight. Right at the heart of it sits Acid-base titrations. This isn’t just a topic you memorize to tick off a box; it’s a core concept that connects chemical equilibria, pH calculations, and practical lab reality.
Standard textbooks like Physical Chemistry by Atkins or the classic problem-solver Physical Chemistry by Irodov dive incredibly deep into these principles. But let’s break it down into what you actually need to clear your concepts and tackle those tricky exam questions from Acid-base titrations. We will look at how acid-base equilibria work, how to navigate titration curves, and how to pick the right indicator without losing your mind during the exam.
Acid-base titrations For IIT JAM: Principles and Techniques
At its core, an acid-base titration is just a controlled neutralization reaction. You take an acid, mix it with a base, and watch them neutralize each other to form salt and water. The classic textbook equation looks like this:
![]()
Here, HA is your acid, BOH is the base, BA is the salt, and H₂O is water.
To figure out exactly when this reaction wraps up, we use indicators in Acid-base titrations. Think of an indicator as a chemical sensor that flips a color switch when the pH hits a specific range. Phenolphthalein, methyl orange, and litmus are the usual suspects here. They change color across distinct pH windows, giving you a visual cue that the reaction is moving along.
Then there is the equivalence point, which is also called the stoichiometric point. This is the exact moment when the moles of your acid perfectly match the moles of your base. If you are mixing a strong acid with a strong base, the solution hits a neutral pH of 7 at this exact point.
How do we track this down precisely? Through pH monitoring. Instead of just watching for a color change, you measure the pH at regular intervals using a pH meter. When you plot the pH against the volume of the titrant you’ve added, you get a curve. Right around the equivalence point, the pH shoots up or drops down incredibly fast. That steep vertical jump on your graph is your golden ticket to finding the exact equivalence point.
Worked Example: Acid-base titration of HCl with NaOH
Let’s say you have a 25.0 mL sample of an unknown HCl solution, and you titrate it with 0.1 M NaOH. The reaction requires exactly 30.0 mL of NaOH to hit that equivalence point. How do we find the concentration of the HCl?
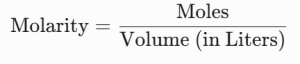
First, find the moles of NaOH you added. You can use the basic formula:
![]()
-
Molarity of NaOH = 0.1 M
-
Volume of NaOH = 30.0 mL = 0.03 L
-
Moles of NaOH = $0.1 × 0.03 = 0.003 mol
Because HCl is a monoprotic acid, it gives up exactly one proton (H+) per molecule. So, at the equivalence point, the moles of HCl will match the moles of NaOH perfectly.
-
Moles of HCl = 0.003 mol
Now, let’s calculate the molarity of the HCl solution:
-
Volume of HCl = 25.0 mL= 0.025 L
-
Molarity of HCl = 0.003/0.025 = 0.12 M
Common Misconceptions in Acid-base titrations For IIT JAM
Let’s clear up a massive point of confusion that trips up a lot of students: the difference between the equivalence point and the endpoint. They are not the same thing.
-
The equivalence point is the theoretical perfection mark where the moles of acid and base match up perfectly.
-
The endpoint is simply the physical moment your indicator actually changes color.
Students often think these two points overlap perfectly in Acid-base titrations. In reality, they don’t always match. An indicator might flip its color a little bit before or slightly after the actual equivalence point. This gap introduces a tiny bit of titration error. That’s why picking an indicator that changes color as close to the equivalence point as possible is so important.
Another common myth is that you always need to do continuous pH monitoring. While tracking the pH with a meter gives you great data, a simple indicator color change is often more than enough for a standard lab run. Also, don’t trust indicators blindly. They have their own limitations, and if you pick the wrong one, your endpoint data will be way off.
Here is a quick summary to keep straight:
-
The equivalence point is the exact stoichiometric balance point.
-
The endpoint is just when the indicator changes color.
-
You don’t always need a pH meter for every single titration.
-
Indicators aren’t perfect; picking the wrong one leads to bad data.
Real-world Applications of Acid-base titrations For IIT JAM
To make sense of why we spend so much time on this, let’s look at how these reactions play out in real life. Imagine a fictional team of environmental scientists checking a local lake after reports of severe acid rain. Acid rain happens when things like sulfur dioxide and nitrogen oxides mess with the atmosphere. To see how badly the lake’s ecosystem is hurting, the team takes water samples back to the lab and runs acid-base titrations. By measuring how much base it takes to neutralize the water, they can calculate the exact acid levels and figure out how to save the local aquatic life.
Over in the pharmaceutical world, quality control teams rely heavily on these principles to keep us safe. They use a method called potentiometric titration to check the exact amount of active ingredients in things like aspirin or antacids. This step makes sure your medicine is actually at the right strength before it hits the pharmacy shelves. They even use it to track how a drug breaks down over time so they can print an accurate expiration date on the box.
You will also see these techniques used to police environmental pollutants in wastewater or to run a Gran plot analysis—a clever graphical trick that helps map out pollutant levels in tricky water samples. Even the food industry uses it. Ever wonder how companies keep a bottle of orange juice or a batch of cheese tasting exactly the same? They use titrations to monitor acidity levels, keeping your food safe and tasting right.
Exam Strategy: Tips and Tricks for Acid-base titrations For IIT JAM
Cracking the IIT JAM questions on this topic boils down to mastering the core fundamentals. You need to be completely comfortable with strong versus weak acids and bases, calculating pH at various stages, and reading titration curves. Make sure you have a solid handle on the classic theories too—Arrhenius, Bronsted-Lowry, and Lewis.
When you start practicing Acid-base titrations, start with basic strong acid-strong base calculations to get your confidence up, then jump into the tougher weak acid or polyprotic problems. Here at VedPrep, we see students struggle most when they try to memorize formulas instead of understanding the chemistry happening in the beaker.
Keep your focus on these highly tested areas:
-
Finding the pH of strong/weak acids and bases.
-
Matching the right indicators to specific titration curves.
-
Buffer solutions and how they resist pH changes.
Tackling a structured study plan and practicing real exam-style problems is the best way to take the stress out of Physical Chemistry.
Types of Acid-base titrations For IIT JAM: Strong and Weak Acids
How a titration curve behaves depends entirely on the strength of your starting components. A strong acid or strong base breaks down completely in water, unleashing a high concentration of H⁺ or OH⁻ ions.
When you titrate a strong acid with a strong base, the chemistry is simple:
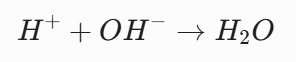
The titration curve for this reaction shows a massive, sudden vertical jump in pH right around the equivalence point. Because the jump is so large, you have a lot of flexibility with your indicator choice.
Things get a bit more complicated when you titrate a weak acid with a strong base. Weak acids only partially break down in water. As you add the strong base, the weak acid converts into its conjugate base. This creates a buffer solution—a mixture that actively fights off major changes in pH.
-
Buffers are incredibly useful for keeping the pH steady during the middle phase of the titration.
-
To calculate the pH inside this buffer zone, you’ll want to use the Henderson-Hasselbalch equation:
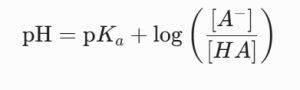
Because the pH doesn’t jump as drastically at the equivalence point here, your choice of indicator becomes incredibly narrow. You have to understand this balancing act to get accurate results on exam day.
Challenges and Limitations of Acid-base titrations For IIT JAM
In the lab, acid-base titrations require excellent technique. Your main tools are burettes and pipettes, which let you measure and deliver liquids down to the drop.
As per Acid-base titrations, when you are trying to calculate the exact concentration of an unknown sample, even a tiny error of a few drops can completely throw off your math. That is why taking care of your glassware, reading the meniscus correctly, and proper calibration matter so much.
Even with the best intentions, lab mistakes happen in Acid-base titrations. If you don’t swirl the flask enough, you get incomplete mixing, which makes you overshoot your endpoint. Swirling constantly ensures the reaction keeps up with the drops falling from your burette. Equipment handling errors or using a degraded indicator solution can also introduce systematic errors into your data. Staying mindful of these small details is what separates a messy lab session from perfectly clean data.
Final Thoughts
Mastering acid-base titrations isn’t about memorizing every single equation under the sun—it’s about visualizing exactly what is happening inside that conical flask drop by drop. Once you can intuitively see how the pH shifts from the initial buffer zone to that steep vertical jump at the equivalence point, the exam questions start to feel a lot less intimidating. Take your time with the graph profiles, get comfortable transitioning between weak and strong species, and keep practicing those numerical variations.
To know more in detail from our faculty, watch our YouTube video:
Frequently Asked Questions
Why does the pH jump so drastically near the equivalence point?
Near the equivalence point, the concentration of the excess reactant becomes very low. Adding even a single drop of titrant causes a massive percentage change in the H+ or OH- concentration, causing the pH to shoot up or down instantly.
Can we use any indicator for a strong acid-strong base titration?
Pretty much! Because the vertical pH jump at the equivalence point is so large (usually from pH 3 to 11), common indicators like phenolphthalein or methyl orange will both work perfectly fine.
What is a monoprotic acid?
A monoprotic acid is an acid that releases exactly one proton (H⁺) per molecule when it dissolves in water. Classic examples include HCl and HNO₃..
How do you choose the right indicator for a weak acid-strong base titration?
You need an indicator that changes color in the basic range (above pH 7), because the conjugate base formed at the equivalence point makes the solution slightly basic. Phenolphthalein is a great choice here.
What is a buffer solution, and when does it form during a titration?
A buffer solution resists major changes in pH. It forms during the titration of a weak acid with a strong base (or vice versa) when the weak acid and its newly formed conjugate base coexist in the flask.
What is the pH at the equivalence point of a weak acid-strong base titration?
The pH will always be greater than 7. This happens because the weak acid is entirely converted into its conjugate base, which reacts with water to produce excess OH⁻ ions.
Why does a strong acid-strong base titration have an equivalence point pH of exactly 7?
The salt formed (like NaCl) comes from a strong acid and a strong base, meaning its ions do not react with water. The water autoionization controls the solution, keeping the pH perfectly neutral at 25°C.
What is a Gran plot analysis used for?
A Gran plot is a graphical method used to find the exact equivalence point in tricky titrations, especially when dealing with very weak acids or highly diluted environmental pollutants where the standard titration curve curve isn't sharp enough.
Is continuous pH monitoring always required in the lab?
Not always. While tracking pH with a meter gives you a highly detailed curve, using a simple visual indicator is often plenty accurate for standard routine lab work.
What tools are essential for a precise acid-base titration?
You will definitely need a high-quality burette to deliver the titrant drop by drop, a volumetric pipette to measure out your unknown solution, and a clean conical flask.
What happens if you don't swirl the flask during a titration?
You will end up with incomplete mixing. The titrant will pool in one spot, causing the indicator to change color prematurely or forcing you to overshoot the true endpoint.
What is a polyprotic acid?
A polyprotic acid can donate more than one proton per molecule. For example, H₂SO₄ is diprotic (two protons), and H₃PO₄ is triprotic (three protons). They show multiple equivalence points on a curve.
How many titration curves jumps will you see with a diprotic acid?
You will see two distinct vertical jumps on the curve, representing the neutralization of the first proton, followed by the neutralization of the second proton.
Can you perform a titration between a weak acid and a weak base?
You can, but it is rarely done for quantitative analysis. The pH change near the equivalence point is incredibly gradual and flat, making it almost impossible to catch a sharp color change with a visual indicator.