
A Jablonski diagram is a graphical representation of energy levels and transitions in a molecule, used to understand electronic spectroscopy and molecular behavior, crucial for RPSC Assistant Professor exams like CSIR NET and IIT JAM.
Jablonski Diagram: Syllabus
Molecular Spectroscopy is a huge chunk of Physical Chemistry, specifically sitting under Unit 5 (Spectroscopy) in the official CSIR NET syllabus. But if you are eyeing the RPSC Assistant Professor exam or even prepping for IIT JAM and CUET PG, you already know this topic isn’t one you can skip. It forms the backbone of how we understand molecular structures.
At its core, Molecular Spectroscopy is all about how matter and electromagnetic radiation interact. It is where we study the nitty-gritty of infrared (IR) spectroscopy, Raman spectroscopy, and electronic spectroscopy. When you are digging into electronic excitation, the Jablonski diagram is the ultimate tool you will need to map out what happens to a molecule when light hits it.
If you want to dive deep into the textbooks, standard references like Physical Chemistry by Peter Atkins and Julio de Paula, or Donald A. McQuarrie and John D. Simon’s Physical Chemistry: A Molecular Approach are excellent choices. Another great guide for wrapping your head around the math and theory is Quantum Mechanics and Spectroscopy by Harris. At VedPrep, we always recommend keeping these classics on your desk.
Jablonski Diagram: A Visual Representation of Molecular Energy Levels
Think of a Jablonski diagram as an energy roadmap for a molecule. Named after Alexander Jablonski who introduced it in the 1930s, this chart stacks energy levels vertically. The absolute lowest energy state—the ground state—sits at the bottom, while the higher, excited energy states sit on top.
Energy
▲
│ ▲ [Absorption] │ [Internal Conversion] │ [Fluorescence]
│ │ ▼ ▼
│ ─────── S1 ─────────────────────────────────
│ │ [Intersystem Crossing]
│ ▼
│ ─────── T1 ───
│ │ [Phosphorescence]
│ ▼
│ ─────── S0 ─────────────────────────────────────────
└────────────────────────────────────────────────────────► Time
Each horizontal line represents a specific electronic state, meaning a particular configuration of the molecule’s electrons. The arrows running between these lines show the allowed transitions when a molecule absorbs or spits out energy.
For the RPSC Assistant Professor exam, you need to know the three main types of transitions cold:
- Absorption: Taking in light to jump up a level.
- Emission: Dropping down and releasing light.
- Non-radiative transitions: Slipping between states without emitting light.
To make sense of photophysical and photochemical processes, you have to read these arrows correctly. The diagram breaks down complex behaviors into three key features:
- Singlet (S) and Triplet (T) states: These tell you the spin multiplicity of the electrons. In a singlet state, all electron spins are paired. In a triplet state, two electron spins are parallel.
- Vibronic levels: The thinner lines clustered above each main electronic state show how electronic and vibrational energy blend together.
- Transition arrows: Straight lines mean radiative transitions (light is involved), while wavy lines show non-radiative steps (heat is dissipated).
Worked Example: Solved Jablonski Diagram Problem For RPSC Assistant Professor
Let’s look at a typical problem you might encounter in the exam room.
Problem: A Jablonski diagram shows a molecule with two energy levels, S0 and S1, with energies 0 eV and 3.5 eV, respectively. The molecule absorbs a photon and jumps from S0 to S1. If the absorbed photon has a wavelength of 355 nm, calculate the energy difference between the levels.
To solve this, we find the energy of the incoming photon using the classic formula:
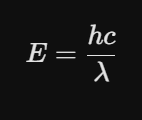
Where:
- h (Planck’s constant) = 6.626 \times 10-34 J s
- c (Speed of light) = 3 × 10⁸ m/s
- λ (Wavelength) = 355 × 10-9 m
Let’s plug in the numbers:

Now, convert Joules to electron-volts (eV) by dividing by the charge of an electron (1.602 × 10⁻¹⁹ J/eV):
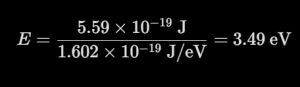
Our calculated photon energy (3.49 eV) matches up perfectly with the 3.5 eV gap between S0 and S1. In the real world, engineers use this exact relationship to design optoelectronic gadgets like highly efficient solar cells and bright LEDs.
Common Misconceptions About Jablonski Diagrams For RPSC Assistant Professor
A frequent mistake students make is treating a Jablonski diagram like a static map that only displays energy levels. If you look at it that way, you miss the entire point. The real magic of the diagram lies in the paths between those lines—the interactions, timelines, and decay routes.
It doesn’t just show where a molecule can sit; it shows how it moves. It maps out absorption, fast non-radiative drops, and the differences between fluorescence and phosphorescence.
This diagram also helps visualize principles like the Franck-Condon principle, which explains why electronic transitions happen so fast that the nuclei don’t even have time to move. Mastering these nuances is what separates a passing score from a top rank in competitive exams like CSIR NET, GATE, and the RPSC interview stage.
Jablonski diagram For RPSC Assistant Professor: Applications
Spectroscopists rely on Jablonski diagrams to read molecular behavior and figure out how a molecule reacts to its environment.
The applications spread across chemistry, physics, and materials science:
- In Chemistry: It helps us predict photochemical reactions and see how stable a dye molecule will be under intense sunlight.
- In Physics: It is the go-to tool for breaking down luminescence, fluorescence, and phosphorescence mechanisms.
- In Materials Science: Scientists use it to engineer fresh optical materials with custom properties.
Imagine a fictional scenario where a tech team wants to create a glow-in-the-dark emergency sign that stays lit for hours without electricity. They need a molecule that doesn’t just fluoresce (emit light instantly and stop) but instead undergoes intersystem crossing to a triplet state, slowly releasing light over time through phosphorescence. By tracking these paths on a Jablonski diagram, researchers can tweak the molecular structure to prolong that glow.
Jablonski diagram For RPSC Assistant Professor: Exam Strategy
If you want to clear the RPSC Assistant Professor exam, memorizing the shapes of these arrows won’t cut it. The examiners like to test whether you understand the actual physical mechanisms behind the drawing.
Key Subtopics to Focus On:
- Differentiating the Transitions: You should know exactly why Internal Conversion (IC) happens between states of the same spin multiplicity (S1 → S0), while Intersystem Crossing (ISC) happens between different multiplicities (S1 → T1).
- Lifetimes of States: Singlet excited states have short lifetimes (nanoseconds), leading to quick fluorescence. Triplet states are forbidden transitions back to the ground singlet state, meaning they have long lifetimes (milliseconds to hours), leading to slow phosphorescence.
- Problem-Solving: Practice translating experimental wavelengths, quantum yields, and quenching rates directly onto the diagram.
A good way to prepare is by sketching the diagram from scratch and explaining each pathway to a peer. At VedPrep, we have built targeted practice sets to help you apply these concepts to tricky exam questions. For a complete visual breakdown, you can also watch this free VedPrep lecture on the Jablonski diagram For RPSC Assistant Professor to see these transitions explained step-by-step.
Jablonski diagram For RPSC Assistant Professor: Components
Let’s do a quick recap of the anatomy of the diagram so it sticks:
| Component | Visual Representation | What It Represents |
| Horizontal Lines | Main stacks (S0, S1, T1) | Electronic energy states based on electron spin configurations. |
| Thin Sub-Lines | Equidistant lines above main states | Vibrational levels (v = 0, 1, 2…) within that electronic state. |
| Straight Upward Arrow | Solid vertical line | Light absorption (happens instantly, ∼ 10-15 s). |
| Straight Downward Arrow | Solid vertical line | Radiative emission (Fluorescence from S1 or Phosphorescence from T1). |
| Wavy Arrows | Squiggly vertical or horizontal lines | Non-radiative dissipation (Heat loss via vibrational relaxation, IC, or ISC). |
When you look at this layout, you are seeing a molecule’s lifetime play out in real time, helping you predict exactly how a compound will handle an influx of photon energy.
Jablonski diagram For RPSC Assistant Professor: Transitions
Beyond single molecules, Jablonski diagrams help explain what happens when molecules bump into each other. These intermolecular interactions dictate the photophysical properties of a solution or a solid mixture.
When an excited molecule interacts with its neighbors, it can cause:
- Energy Transfer: Passing the excited energy packet to a neighbor.
- Quenching: A bystander molecule stealing the energy and turning it into harmless heat, killing the fluorescence.
- Sensitization: An excited molecule kicking a neighboring molecule into an active state to start a chemical reaction.
When a molecule absorbs light, it doesn’t just change its electronic state; it undergoes rotational and vibrational transitions too. The Jablonski diagram gives you a clear snapshot of these potential energy states all at once. Getting a firm grip on these advanced details will give you a massive advantage when tackling physical chemistry problems under exam pressure. Keep practicing, keep sketching, and you will have this topic mastered in no time.
Final Thoughts
Mastering the Jablonski diagram isn’t just about memorizing lines and arrows for exam day; it is about learning to read the secret language of excited molecules. When you can look at a transition and instantly visualize the changes in electron spin, lifetime scales, and energy dissipation, you have moved past rote learning into true conceptual clarity. This deep understanding is exactly what examiners look for in competitive exams like the RPSC Assistant Professor, CSIR NET, and GATE.
To learn more in detail from our faculty, watch our YouTube video:
Frequently Asked Questions
Who developed the Jablonski diagram?
The Jablonski diagram was developed by Alexander Jablonski, a Polish physicist, in the 1930s. His work laid the foundation for understanding the interactions between light and matter.
What are the main components of a Jablonski diagram?
A Jablonski diagram typically consists of horizontal lines representing energy levels, with the ground state at the bottom and excited states above. Vertical arrows indicate transitions between these states, while horizontal lines may represent vibrational levels within each electronic state.
What is the significance of the Jablonski diagram in photochemistry?
The Jablonski diagram is essential in photochemistry as it helps predict and explain the behavior of molecules under light excitation, including fluorescence, phosphorescence, and other photophysical processes.
How does the Jablonski diagram relate to physical and organic chemistry?
The Jablonski diagram is relevant to both physical and organic chemistry as it provides insights into the physical processes underlying chemical reactions and the behavior of organic molecules under various conditions, including light exposure.
What is the role of spin states in Jablonski diagrams?
Spin states play a crucial role in Jablonski diagrams, as they determine the allowed transitions between energy levels. Understanding spin states is essential for predicting and interpreting photochemical reactions.
What are the limitations of Jablonski diagrams?
Jablonski diagrams have limitations, such as neglecting certain interactions or assuming a simplified molecular structure. Understanding these limitations is essential for accurately interpreting and applying the diagrams.
How can I apply the Jablonski diagram to RPSC Assistant Professor exam questions?
To answer exam questions related to the Jablonski diagram, focus on understanding the underlying principles of photochemistry and energy level transitions. Practice applying these concepts to different scenarios and molecules.
What types of questions can I expect related to Jablonski diagrams in the RPSC Assistant Professor exam?
You can expect questions that test your understanding of the Jablonski diagram's construction, interpretation, and application in various contexts, including photochemistry, physical chemistry, and organic chemistry.
How can I effectively communicate my understanding of Jablonski diagrams in exam answers?
To effectively communicate your understanding, use clear and concise language, and be sure to label and explain each component of the diagram. Provide relevant examples and applications to demonstrate your knowledge.
What common mistakes should I avoid when working with Jablonski diagrams?
Common mistakes include misinterpreting energy level transitions, neglecting vibrational levels, and failing to account for different types of radiation. Ensure you carefully label and analyze each component of the diagram.
What are some common misconceptions about Jablonski diagrams?
Common misconceptions include assuming that Jablonski diagrams only apply to simple molecules or that they only illustrate radiative transitions. Ensure you have a comprehensive understanding of the diagram's components and applications.
How does the Jablonski diagram relate to non-radiative transitions?
The Jablonski diagram can illustrate non-radiative transitions, such as internal conversion and intersystem crossing, which are crucial in understanding photochemical reactions and the behavior of excited molecules.
Can Jablonski diagrams be applied to complex systems or only simple molecules?
While Jablonski diagrams are often illustrated using simple molecules, they can be applied to complex systems as well. However, the complexity of the diagram and the analysis required increase significantly with the number of energy levels and interactions involved.
How does the Jablonski diagram relate to photochemical reactions?
The Jablonski diagram is essential in understanding photochemical reactions, as it illustrates the energy level transitions that occur during these reactions. This understanding is crucial for predicting and controlling photochemical outcomes.